Difference between revisions of "SimpleGraph"
| (32 intermediate revisions by 2 users not shown) | |||
| Line 1: | Line 1: | ||
| − | {{SimpleArticle|title=SimpleGraph|text= | + | {{SimpleArticle|title=SimpleGraph|text={{OsProject|id=com.bitplan.simplegraph|owner=BITPlan|title=SimpleGraph System API wrapper|url=https://github.com/BITPlan/com.bitplan.simplegraph|version=0.0.5|date=2019-03-23}} |
is an open source project that allows to wrap Systems APIs in a way that graph algorithms and storage can be applied. As an implementation [http://tinkerpop.apache.org Apache Tinkerpop/Gremlin] is used.}} | is an open source project that allows to wrap Systems APIs in a way that graph algorithms and storage can be applied. As an implementation [http://tinkerpop.apache.org Apache Tinkerpop/Gremlin] is used.}} | ||
| + | |||
| + | {{:SimpleGraph/Links}} | ||
| + | |||
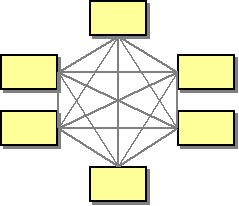
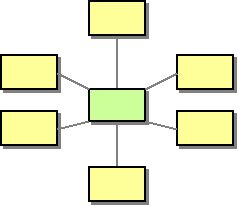
| + | SimpleGraph uses the [http://www.enterpriseintegrationpatterns.com/ramblings/03_hubandspoke.html Hub and Spoke] and Adapter patterns heavily. | ||
| + | |||
| + | http://www.enterpriseintegrationpatterns.com/img/IntegrationSpaghetti.gif | ||
| + | http://www.enterpriseintegrationpatterns.com/img/MessageBroker.gif | ||
= Modules = | = Modules = | ||
| − | + | There are currently {{#ask: [[Concept:SimpleGraphModule]]|format=count}} Modules available for SimpleGraph. | |
| − | + | Each module wraps an "external" API to make the functions and data behind that API available for graph processing with Apache Tinkerpop / Gremlin. | |
| − | + | == Module Hub and Spoke == | |
| − | + | {{:SimpleGraphModuleHubAndSpoke}} | |
| − | |||
| − | |||
| + | == Module Details == | ||
| + | {{SimpleGraphModuleMarkup|#userparam=intro}} | ||
| + | {{#ask: [[Concept:SimpleGraphModule]] | ||
| + | | mainlabel=SimpleGraphModule | ||
| + | | ?SimpleGraphModule name = name | ||
| + | | ?SimpleGraphModule modulename = modulename | ||
| + | | ?SimpleGraphModule systemname = systemname | ||
| + | | ?SimpleGraphModule logo = logo | ||
| + | | ?SimpleGraphModule apiname = apiname | ||
| + | | ?SimpleGraphModule apiurl = apiurl | ||
| + | | ?SimpleGraphModule url = url | ||
| + | | ?SimpleGraphModule documentation = documentation | ||
| + | | sort=SimpleGraphModule name | ||
| + | | format=template | ||
| + | | link=none | ||
| + | | userparam=row | ||
| + | | named args=yes | ||
| + | | template=SimpleGraphModuleMarkup | ||
| + | }} | ||
| + | {{SimpleGraphModuleMarkup|#userparam=outro}} | ||
| + | |||
| + | = Introduction = | ||
{{SimpleArticle|title=Motivation|text=Solving IT Problems across System boundaries can get very difficult. There may be a wealth of APIs which first looks helpful but given the diversity of approaches | {{SimpleArticle|title=Motivation|text=Solving IT Problems across System boundaries can get very difficult. There may be a wealth of APIs which first looks helpful but given the diversity of approaches | ||
it a daunting task will need to be tackled to get reasonable results. More often than not projects are not even started since the cost/benefit ratio is not good enough. | it a daunting task will need to be tackled to get reasonable results. More often than not projects are not even started since the cost/benefit ratio is not good enough. | ||
SimpleGraph aims to supply a unified graph API access to Systems for which this makes sense. In fact for most systems it makes sense to have a graph API. Quite a few problems will get much easier to solve if the subdivision of the problem is done with the goal to apply graph algorithms. | SimpleGraph aims to supply a unified graph API access to Systems for which this makes sense. In fact for most systems it makes sense to have a graph API. Quite a few problems will get much easier to solve if the subdivision of the problem is done with the goal to apply graph algorithms. | ||
| + | See {{Link|target=SiGNaL#What_happens_if_you_view_the_world_as_a_graph.3F|title=What happens if you see the world as a graph?}} | ||
}} | }} | ||
| − | {{ | + | {{SimpleArticle|title=Use Cases|text= |
| − | == | + | == Mix and Match Office and other data == |
| − | Let's assume we have the following | + | Let's assume we have a business that works in the following manner: |
| + | # There are pricelist for product categories in Microsoft Excel files | ||
| + | # Product specifications are in PDF Format - the files are referenced in the Excel files | ||
| + | # Invoices are written in Microsoft Word | ||
| + | # There is an address book of customers in VCard format | ||
| + | # Orders are handled via e-mail (that is automatically produced by the companies shop website) | ||
| + | # Monthly reports are created with PowerPoint | ||
| + | The monthly reports should in the future be modified to give geographical information. Basically a revenue/region sales count per product/region information is wanted. | ||
| + | |||
| + | The 1000 dollar question - can this report be created efficiently semi-manually with reasonable software effort? | ||
| + | Sadly it sounds more like 10.000 or 100.000 dollar question. | ||
| + | |||
| + | There are at least 6 different systems involved. | ||
| + | SimpleGraph simplifies accessing all 6 systems. | ||
| + | }} | ||
| + | {{SimpleArticle|title=Examples|text= | ||
| + | == Air Routes == | ||
| + | The AirRoutes example is taken from [http://kelvinlawrence.net/book/Gremlin-Graph-Guide.html Practical Gremlin: An Apache TinkerPop Tutorial by Kelvin Lawrence] see also https://github.com/krlawrence/graph. | ||
<uml> | <uml> | ||
hide circle | hide circle | ||
package AirRoutes { | package AirRoutes { | ||
| + | note top of airport: 3374 | ||
class airport { | class airport { | ||
country | country | ||
| Line 35: | Line 81: | ||
desc | desc | ||
} | } | ||
| + | note top of version: 1 | ||
class version { | class version { | ||
code | code | ||
| Line 40: | Line 87: | ||
desc | desc | ||
} | } | ||
| + | note top of country: 237 | ||
class country { | class country { | ||
code | code | ||
| Line 45: | Line 93: | ||
desc | desc | ||
} | } | ||
| + | note top of continent: 7 | ||
class continent { | class continent { | ||
code | code | ||
| Line 53: | Line 102: | ||
airport --> airport: route | airport --> airport: route | ||
| + | note on link: 43400 | ||
continent --> airport: contains | continent --> airport: contains | ||
| + | note on link: 6748 | ||
</uml> | </uml> | ||
| − | |||
| − | |||
| − | |||
| − | |||
| − | |||
| − | |||
| − | |||
| − | |||
| − | |||
| − | + | == JUnit Test case == | |
| − | + | We'd like to read in the air-routes graph described above and create an Excel Work book from it. | |
| − | + | see [https://github.com/BITPlan/com.bitplan.simplegraph/blob/master/simplegraph-excel/src/test/java/com/bitplan/simplegraph/excel/TestExcelSystem.java TestExcelSystem.java] | |
| − | + | === Java Source Code === | |
| + | <source lang='java'> | ||
| + | ExcelSystem es = new ExcelSystem(); | ||
| + | Graph graph = TestTinkerPop3.getAirRoutes(); | ||
| + | GraphTraversalSource g = graph.traversal(); | ||
| + | Workbook wb = es.createWorkBook(g); | ||
| + | assertEquals(6, wb.getNumberOfSheets()); | ||
| + | es.save(wb, testAirRouteFileName); | ||
| + | </source> | ||
| + | View the resulting [[File:Air-routes.xlsx]] Excel file to | ||
| + | see what the tabular version of the graph looks like. | ||
| + | }} | ||
| + | = Links = | ||
| + | * [https://stackoverflow.com/questions/tagged/simplegraph SimpleGraph Stackoverflow Questions] | ||
| + | * [https://groups.google.com/forum/#!forum/simplegraph Google SimpleGraph Discussion Group] | ||
| + | = Documentation = | ||
| + | {{Article|title=Links|text= | ||
| + | * {{Link|target=SimpleGraph-Installation}} | ||
| + | * {{Link|target=SimpleGraph-Tutorial}} | ||
| + | * {{Link|target=SimpleGraph-Core}} | ||
}} | }} | ||
[[Category:frontend]] | [[Category:frontend]] | ||
[[Category:SiGNaL]] | [[Category:SiGNaL]] | ||
[[Category:SimpleGraph]] | [[Category:SimpleGraph]] | ||
Latest revision as of 12:02, 7 March 2021
SimpleGraph
| OsProject | |
|---|---|
| id | com.bitplan.simplegraph |
| state | |
| owner | BITPlan |
| title | SimpleGraph System API wrapper |
| url | https://github.com/BITPlan/com.bitplan.simplegraph |
| version | 0.0.5 |
| description | |
| date | 2019-03-23 |
| since | |
| until | |
is an open source project that allows to wrap Systems APIs in a way that graph algorithms and storage can be applied. As an implementation Apache Tinkerpop/Gremlin is used.
Click here to comment
see SimpleGraph
SimpleGraph uses the Hub and Spoke and Adapter patterns heavily.


Modules
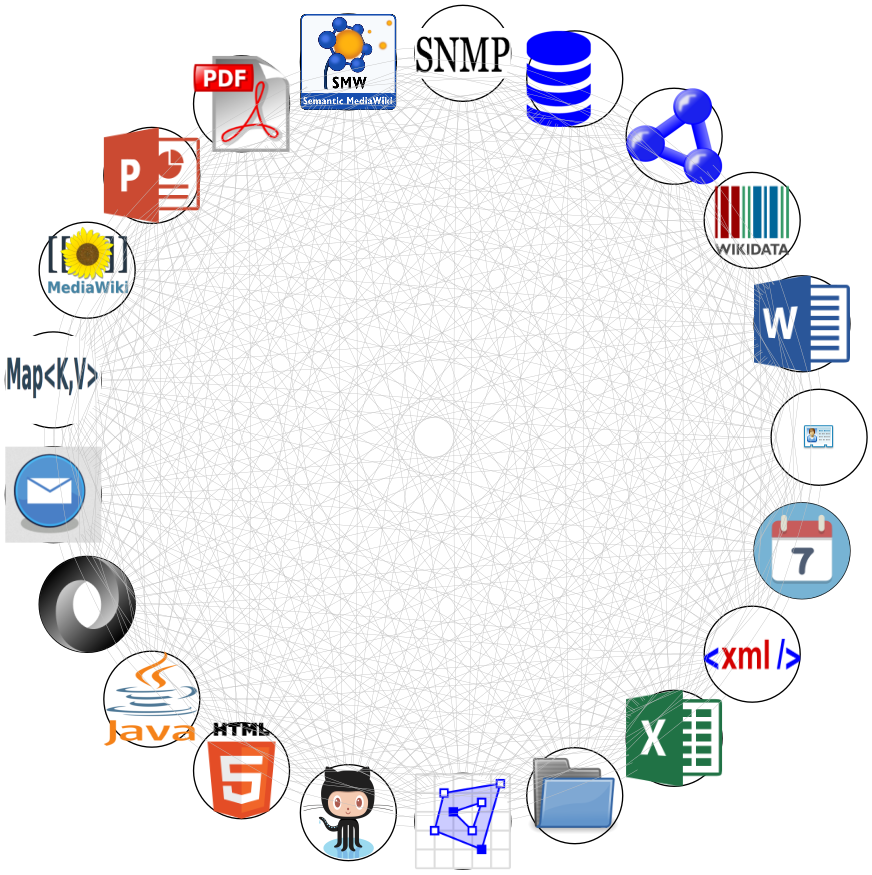
There are currently 21 Modules available for SimpleGraph. Each module wraps an "external" API to make the functions and data behind that API available for graph processing with Apache Tinkerpop / Gremlin.
Module Hub and Spoke

Module Details
| Module | System wrapped | API exposed | Description |
|---|---|---|---|
| CalDAV | ical4j library for parsing and building iCalendar data models | makes Calendar data available via ical4j | |
 CardDAV CardDAV
|
CardDAV | [ ] | makes VCard data available |
 Excel Excel
|
Excel | Apache POI XSSF/HSSF | makes Microsoft Excel workbooks accessible via the Apache POI API |
 FileSystem FileSystem
|
FileSystem | java.io.File | makes your FileSystem accessible via the Java FileSystem API |
 GeoJSON GeoJSON
|
GeoJSON | GeoJSON support for Google gson library | makes GeoJSON data available |
 GitHub GitHub
|
GitHub | GitHub GraphQL Api v4 | makes GitHub content accessible to Graph processing. |
 HTML HTML
|
HTML | HTML Cleaner | makes HTML files accessible via HTML Cleaner parser |
 JSON JSON
|
JSON | JSON | makes JSON parse results accessible to Graph processing. |
 Java Java
|
Java | javaparser | makes Java code parse results accessible to Graph processing. |
| E-Mail access for rfc822 and MIME formatted Mailbox files (e.g. Thunderbird) | makes Mail data available via Apache Mime4J | ||
| MapSystem | java.api.Map | supplies a simple wrapper for a graph with nodes that have key/value pairs in form of HashMaps. We would not really need this since Apache Tinkerpop/Gremlin already supplies us with properties per node/vertex.
Still this system is useful as a helper system and to illustrate the wrapping concepts and possibilities of SimpleGraph | |
 MediaWiki MediaWiki
|
MediaWiki | MediaWiki API | makes MediaWiki site content accessible to Graph processing.
It exposes the MediaWiki API using the mediawiki-japi Library by BITPlan. |
 PDF PDF
|
Apache PDFBox | makes Portable Document Format (PDF) files accessible via the Apache PDFBox® API | |
 PowerPoint PowerPoint
|
PowerPoint | Apache POI XSLF/HSLF | makes Microsoft PowerPoint presentations accessible via the Apache POI API |
 SMW SMW
|
SMW | SemanticMedia Wiki API | makes Semantic MediaWiki accessible via the SMW API |
| SNMP | SNMP4J Simple Network Monitoring Protocol SNMP Java API | makes Simple Network Monitoring Protocol accessible via SNMP4J | |
 SQL SQL
|
SQL | Java Database Connectivity (JDBC) API | makes relational SQL databases accessible via the Java JDBC API. |
| TripleStore | SiDIF-TripleStore | makes BITPlan's SiDIF educational TripleStore accessible | |
 WikiData WikiData
|
WikiData | WikiData Toolkit | makes WikiData data available via the Wikidata-Toolki API |
 Word Word
|
Word | Apache POI XWPF/HWPF | makes Microsoft Word Documents accessible via the Apache POI API |
| XML | org.w3c.dom | makes XML dom parse results accessible to Graph processing. |
Introduction
Motivation
Solving IT Problems across System boundaries can get very difficult. There may be a wealth of APIs which first looks helpful but given the diversity of approaches it a daunting task will need to be tackled to get reasonable results. More often than not projects are not even started since the cost/benefit ratio is not good enough. SimpleGraph aims to supply a unified graph API access to Systems for which this makes sense. In fact for most systems it makes sense to have a graph API. Quite a few problems will get much easier to solve if the subdivision of the problem is done with the goal to apply graph algorithms. See What happens if you see the world as a graph?
Use Cases
Mix and Match Office and other data
Let's assume we have a business that works in the following manner:
- There are pricelist for product categories in Microsoft Excel files
- Product specifications are in PDF Format - the files are referenced in the Excel files
- Invoices are written in Microsoft Word
- There is an address book of customers in VCard format
- Orders are handled via e-mail (that is automatically produced by the companies shop website)
- Monthly reports are created with PowerPoint
The monthly reports should in the future be modified to give geographical information. Basically a revenue/region sales count per product/region information is wanted.
The 1000 dollar question - can this report be created efficiently semi-manually with reasonable software effort? Sadly it sounds more like 10.000 or 100.000 dollar question.
There are at least 6 different systems involved. SimpleGraph simplifies accessing all 6 systems.
Examples
Air Routes
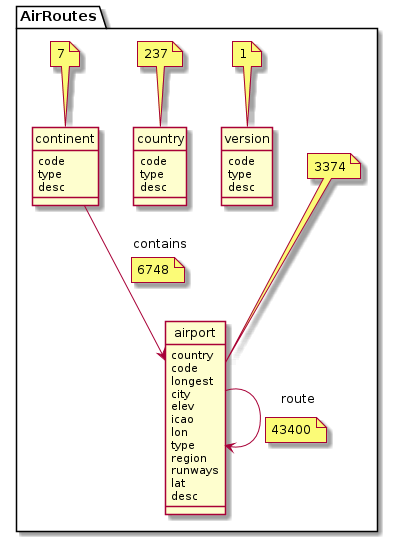
The AirRoutes example is taken from Practical Gremlin: An Apache TinkerPop Tutorial by Kelvin Lawrence see also https://github.com/krlawrence/graph.

JUnit Test case
We'd like to read in the air-routes graph described above and create an Excel Work book from it. see TestExcelSystem.java
Java Source Code
  ExcelSystem es = new ExcelSystem();
  Graph graph = TestTinkerPop3.getAirRoutes();
  GraphTraversalSource g = graph.traversal();
  Workbook wb = es.createWorkBook(g);
  assertEquals(6, wb.getNumberOfSheets());
  es.save(wb, testAirRouteFileName);
View the resulting File:Air-routes.xlsx Excel file to see what the tabular version of the graph looks like.
Links
Documentation
Links