SimpleGraph: Difference between revisions
No edit summary |
No edit summary |
||
| Line 21: | Line 21: | ||
hide circle | hide circle | ||
package AirRoutes { | package AirRoutes { | ||
note top of airport: 3374. | |||
class airport { | class airport { | ||
country | country | ||
| Line 35: | Line 36: | ||
desc | desc | ||
} | } | ||
note top of version: 1. | |||
class version { | class version { | ||
code | code | ||
| Line 40: | Line 42: | ||
desc | desc | ||
} | } | ||
note top of country: 237. | |||
class country { | class country { | ||
code | code | ||
| Line 45: | Line 48: | ||
desc | desc | ||
} | } | ||
note top of continent: 7. | |||
class continent { | class continent { | ||
code | code | ||
| Line 56: | Line 60: | ||
continent --> airport: contains | continent --> airport: contains | ||
</uml> | </uml> | ||
== Mix and Match Office and other data == | == Mix and Match Office and other data == | ||
Let's assume we have a business that works in the following manner: | Let's assume we have a business that works in the following manner: | ||
Revision as of 17:49, 15 February 2018
SimpleGraph
SimpleGraph is an open source project that allows to wrap Systems APIs in a way that graph algorithms and storage can be applied. As an implementation Apache Tinkerpop/Gremlin is used.
Modules
- SimpleGraph-FileSystem
- SimpleGraph-JSON
- SimpleGraph-MapSystem
- SimpleGraph-MediaWiki
- SimpleGraph-Excel
- SimpleGraph-Powerpoint
Motivation
Solving IT Problems across System boundaries can get very difficult. There may be a wealth of APIs which first looks helpful but given the diversity of approaches it a daunting task will need to be tackled to get reasonable results. More often than not projects are not even started since the cost/benefit ratio is not good enough. SimpleGraph aims to supply a unified graph API access to Systems for which this makes sense. In fact for most systems it makes sense to have a graph API. Quite a few problems will get much easier to solve if the subdivision of the problem is done with the goal to apply graph algorithms.
Use Cases
Travel info
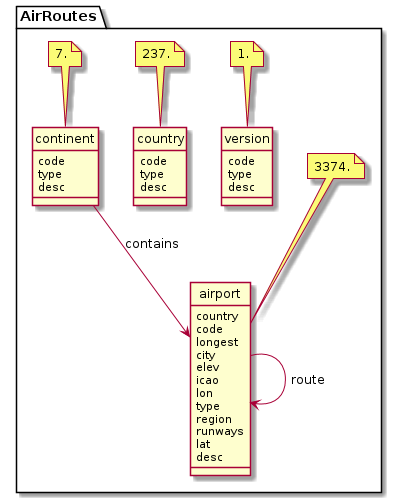
Let's assume we have the following data model:

Mix and Match Office and other data
Let's assume we have a business that works in the following manner:
- There are pricelist for product categories in Microsoft Excel files
- Product specifications are in PDF Format - the files are referenced in the Excel files
- Invoices are written in Microsoft Word
- There is an address book of customers in VCard format
- Orders are handled via e-mail (that is automatically produced by the companies shop website)
- Monthly reports are created with PowerPoint
The monthly reports should in the future be modified to give geographical information. Basically a revenue/region sales count per product/region information is wanted.
The 1000 dollar question - can this report be created efficiently semi-manually with reasonable software effort? Sadly it sounds more like 10.000 or 100.000 dollar question.
There are at least 6 different systems involved.