GraphViz: Difference between revisions
Jump to navigation
Jump to search


(→UML) |
(→UML) |
||
| (4 intermediate revisions by the same user not shown) | |||
| Line 92: | Line 92: | ||
==== Images ==== | ==== Images ==== | ||
<source lang='php'> | |||
<graphviz> | <graphviz> | ||
digraph tools { | digraph tools { | ||
graphviz [ image= | graphviz [ label="" tooltip="graphviz" image="GraphVizLogo.png" ] | ||
} | } | ||
</graphviz> | </graphviz> | ||
</source> | |||
<graphviz> | |||
digraph tools { | |||
graphviz [ label="" tooltip="graphviz" image="GraphVizLogo.png" ] | |||
} | |||
</graphviz> | |||
==== UML ==== | ==== UML ==== | ||
<source lang='php'> | <source lang='php'> | ||
| Line 150: | Line 158: | ||
} | } | ||
</graphviz> | </graphviz> | ||
= Papers = | |||
https://www.researchgate.net/publication/3187542_A_Technique_for_Drawing_Directed_Graphs | |||
Latest revision as of 09:23, 18 February 2020
Graphviz
Documentation
- http://www.graphviz.org
- http://www.graphviz.org/Documentation/dotguide.pdf
- http://www.tonyballantyne.com/graphs.html
- http://www.graphviz.org/doc/fontfaq.txt
- http://stackoverflow.com/questions/tagged/graphviz
- http://graphs.grevian.org/reference
Mediawiki Graphviz extension
Fiddles
Examples
Graph
<graphviz format='svg'>
graph development {
  Stakeholder -- Requirements;
  Requirements -- Samplecases;
  Requirements -- Model;
  Model -- Code;
}
</graphviz>

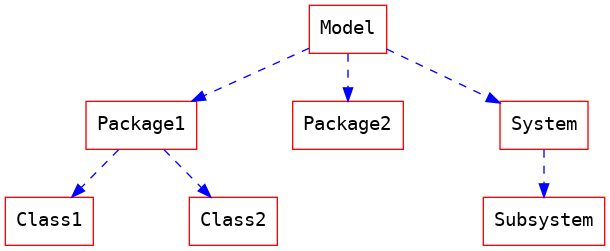
Hierarchy
<graphviz>
digraph hierarchy {
  nodesep=1.0 // increases the separation between nodes

  node [color=Red,fontname=Courier,shape=box] //All nodes will this shape and colour
  edge [color=Blue, style=dashed] //All the lines look like this

  Model->{Package1 Package2 System}
  Package1->{Class1 Class2}
  System->Subsystem
  {rank=same;Subsystem Class1 Class2}  // Put them on the same level
}
</graphviz>

HTML labels
digraph G {
  "Record" [ label=<<table>
              <tr>
                <td>A</td>
                <td bgcolor='#00CC11'>B</td>
               </tr>
              </table>
             >
 ];
}

Images
<graphviz>
digraph tools  {
  graphviz [ label="" tooltip="graphviz" image="GraphVizLogo.png" ]
}
</graphviz>

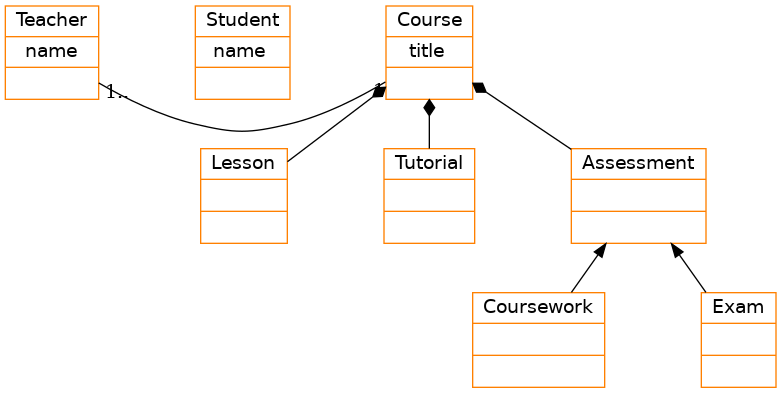
UML
digraph obj{
  nodesep=1.0 // increases the separation between nodes
  node[shape=record, color="#FF8000", fontname = "Technical"];
  rankdir="BT";

  teacher [label = "{<f0> Teacher|<f1> name\n  |<f2> \n   }"];
  course [label = "{<f0> Course|<f1>title \n  |<f2> \n   }"];
  student [label = "{<f0> Student|<f1>name \n  |<f2> \n   }"];
  lesson [label = "{<f0> Lesson |<f1> \n  |<f2> \n   }"];
  tutorial [label = "{<f0> Tutorial|<f1> \n  |<f2> \n   }"];
  assessment[label = "{<f0> Assessment|<f1> \n  |<f2> \n   }"];
  coursework [label = "{<f0> Coursework|<f1> \n  |<f2> \n   }"];
  exam [label = "{<f0> Exam|<f1> \n  |<f2> \n   }"];

  teacher->course [dir="forward",arrowhead="none",arrowtail="normal",headlabel=" 1",taillabel=" 1.."];
  student->course [dir="forward",arrowhead="none",arrowtail="normal",headlabel=" 1",taillabel=" 1.."];
  lesson->course [dir="forward",arrowhead="diamond",arrowtail="normal"];
  tutorial->course [dir="forward",arrowhead="diamond",arrowtail="normal"];
  assessment->course [dir="forward",arrowhead="diamond",arrowtail="normal"];
  coursework->assessment;
  exam->assessment;

  {rank=same; teacher course student};
}

Papers
https://www.researchgate.net/publication/3187542_A_Technique_for_Drawing_Directed_Graphs